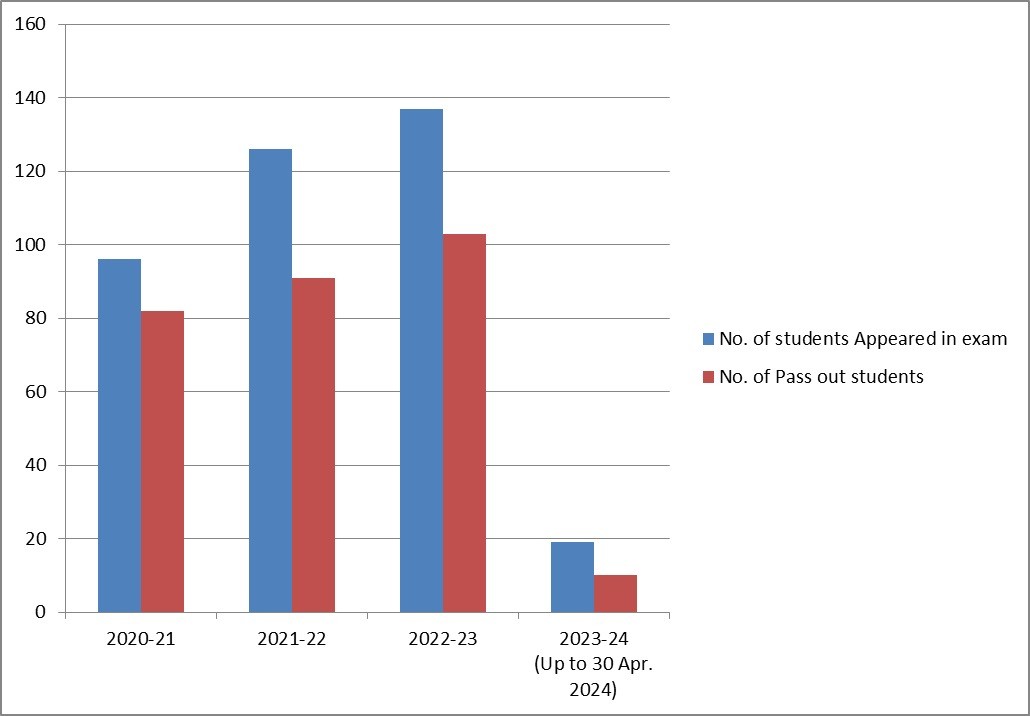
University Examination Results and a Comparative Graph with the Previous three Years

| S.N. | Academic Session | No. of students Appeared in exam | No. of Pass out students |
| 1 | 2020-21 | 96 | 82 |
| 2 | 2021-22 | 126 | 91 |
| 3 | 2022-23 | 137 | 103 |
| 4 | 2023-24 (Up to 30 Apr. 2024) |
19 | 10 |
| 5 | 2024-25 |

